Like any enterprise-class mail server, Carbonio CE carefully captures in a special log all actions occurring on the server, from sending emails and logging in to user accounts, ending with fatal error messages. A detailed log of server operations helps system administrators resolve various failures as quickly as possible, and also allows you to effectively investigate incidents related to the company’s information security. In this article, we will understand how logs are stored on the Carbonio CE server, and how to read them correctly, and we will also understand how, thanks to the logs, you can track the path of specific emails in case of problems.
Where to Look for System Logs
You can find all Carbonio CE main logs of e-mail server operations in the /opt/zextras/log folder. Some of the logs can also be found in /var/log folder.
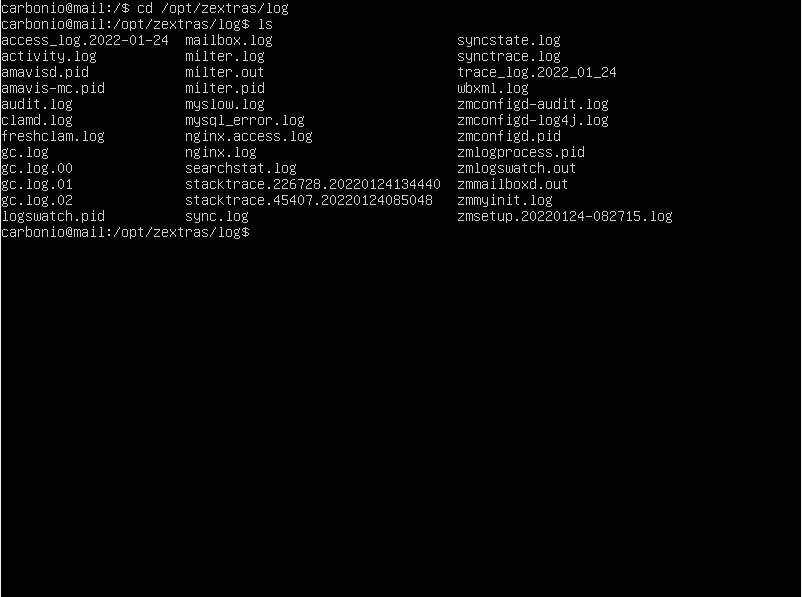
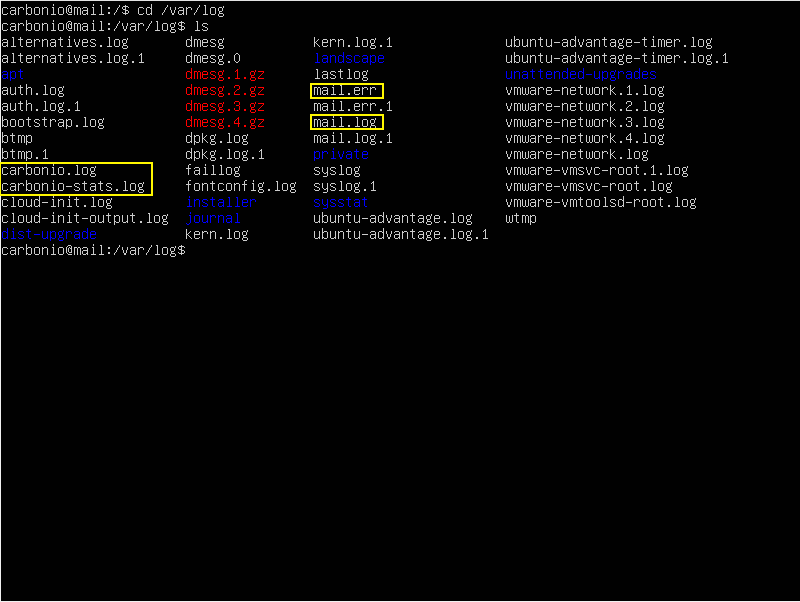
The main log file is /var/log/carbonio.log, which collects information from several other log files at once. The remaining files located in /opt/zextras/log contain information about the operation of individual mail server nodes.
For example, the file audit.log contains information about successful and unsuccessful login attempts, clamd.log contains information about the operation of the antivirus, nginx.access.log logs connections of the Carbonio CE proxy server, and mailbox.log stores information about the operation of mail storage.
As a rule, it is /opt/zextras/log/mailbox.log and /var/log/carbonio.log are the main log files that administrators use when troubleshooting various errors and problems that occur on the server.
How to Read Log Files
All Carbonio CE log files are human-readable records in English. Depending on which log file you open, the entries in them can store different information.
For example, after sending the message, the entries of the file carbonio.log would look like this:
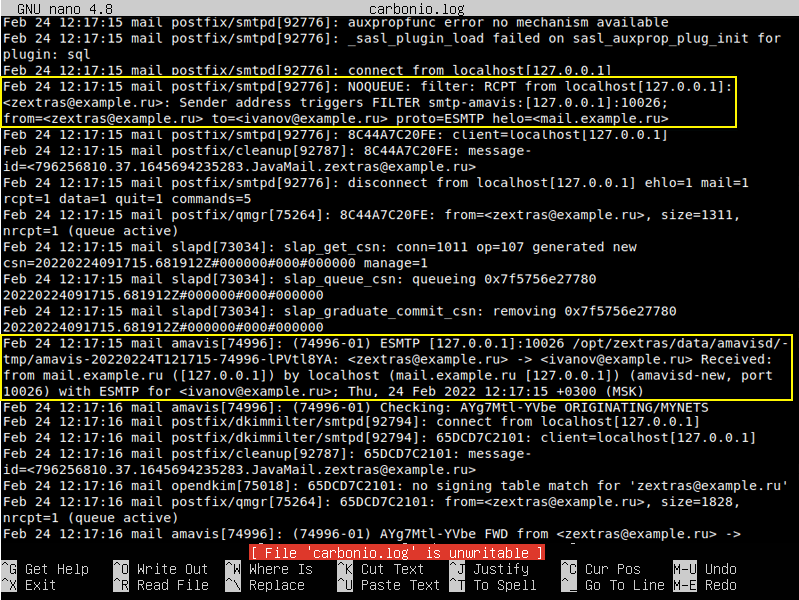
Here you see the timestamp, the name of the server on which the event occurs, the name of the service that generated the entry, and the message itself. Depending on which service and under what conditions created the entry in the log, they may look different.
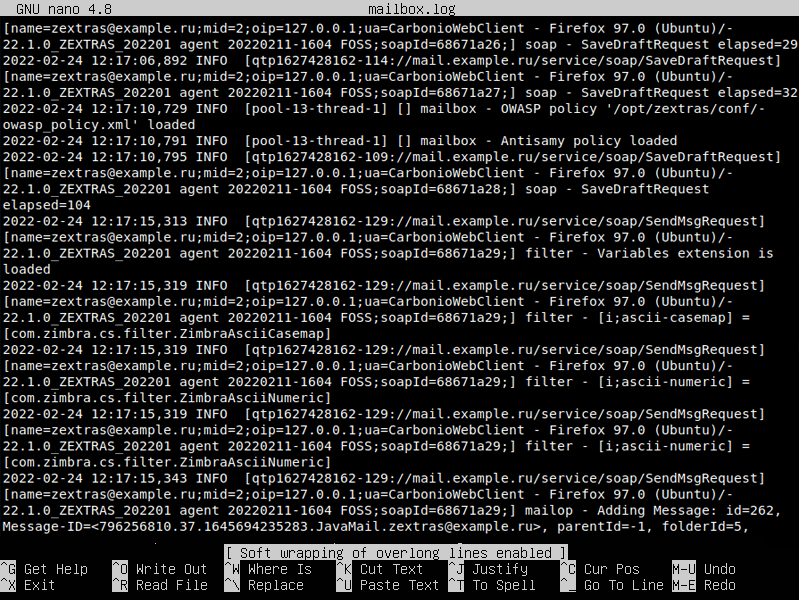
And this is how the same event looks in the file mailbox.log . The main difference here is that all messages have their own log severity. There are 5 levels in total:
- FATAL – this level means the occurrence of an error that is incompatible with the further operation of the server. Among them, for example, loss of connection to the MySQL database.
- ERROR – this level indicates the occurrence of errors that allow the server to continue working or concern a specific user. For example, an error occurs when the index data of one mailbox is damaged, or when an email cannot be deleted from the mailbox.
- WARN – this level indicates potentially dangerous situations that can usually be corrected or even ignored, but it is still better for the administrator to be aware of them. The WARN level is usually marked with messages about failed login attempts.
- INFO – this level of log entries contains information about the performance of certain operations on the server. For example, they mark messages about the successful start of the server, the creation and deletion of accounts, and so on.
- DEBUG – This entry-level is disabled by default and is typically used for server debugging and is used by developers to troubleshoot various issues.
Record levels make it very convenient to find error messages that occur.
Another handy way to find the error is to run
sudo cat /opt/zextras/log/mailbox.log | grep exception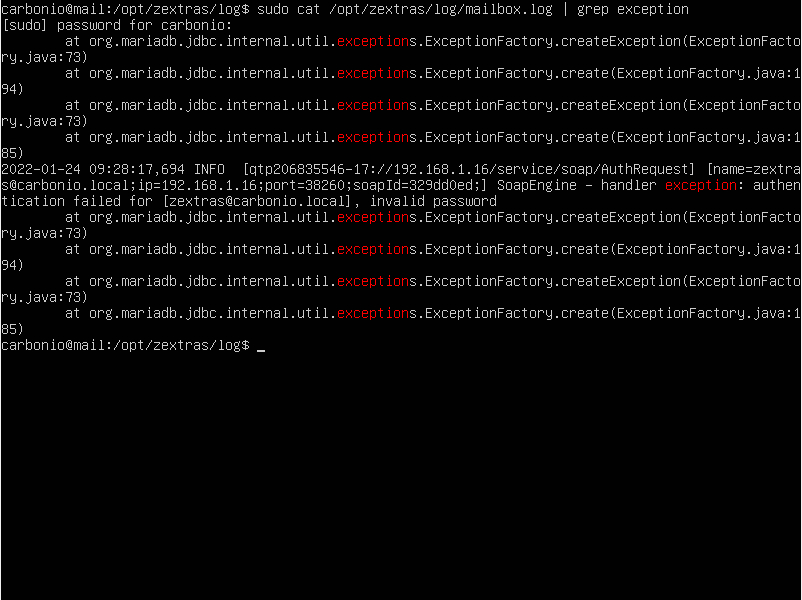
As already mentioned, the audit.log file contains information about users logging into the web client, with information about successful logins being stored at the INFO logging level, and information about unsuccessful logins being stored at the WARN logging level. The the audit.log file looks like this:
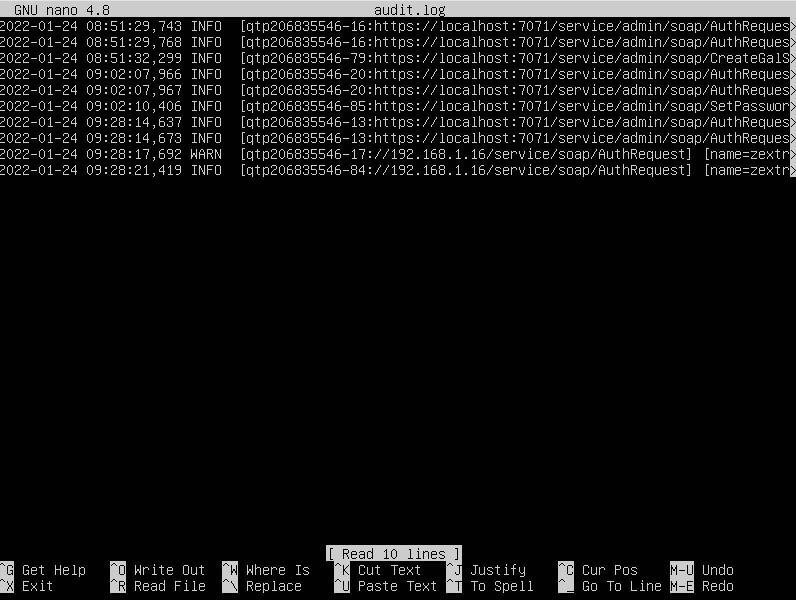
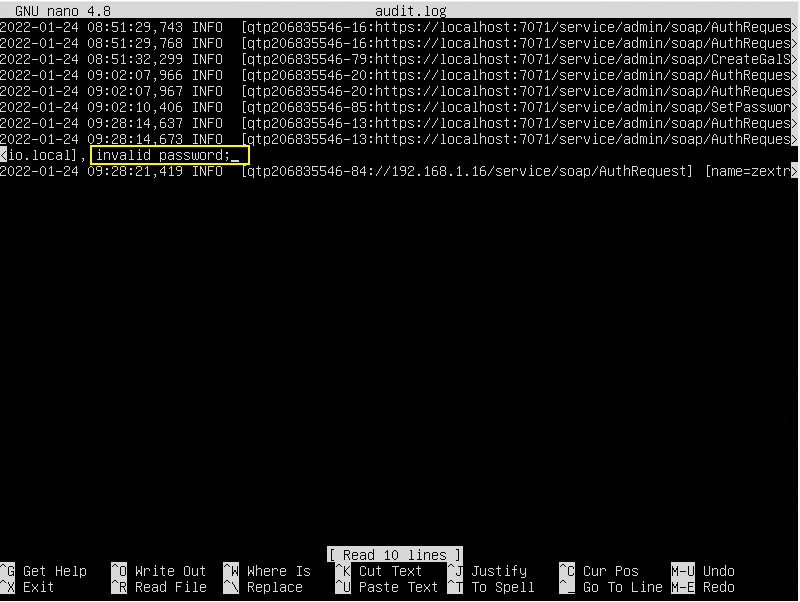
As you can see, in addition to the login failure warning, additional information is displayed about why the login failed. In our case, an incorrectly entered password was the cause of the error.
Email Tracking
Since Postfix writes all the logs to one file, the entries for different messages are constantly overridden. Therefore, when an e-mail does not arrive for some reason, it can be difficult for the administrator to track the path that it took and what caused its delivery failure. To facilitate this task, the zmmsgtrace utility built into Carbonio CE allows you to concatenate records related to one particular letter.
Initially, the zmmsgtrace binary is located in the /opt/zextras/libexec folder. In order not to write the full path each time it is used, you can make a symbolic link to it using the command
sudo ln -s /opt/zextras/libexec/zmmsgtrace /opt/zextras/bin/zmmsgtraceAfter that, go to the Carbonio CE command line and run the command with the required parameters.
The command zmmsgtrace without parameters will display all message logs stored in /var/log/
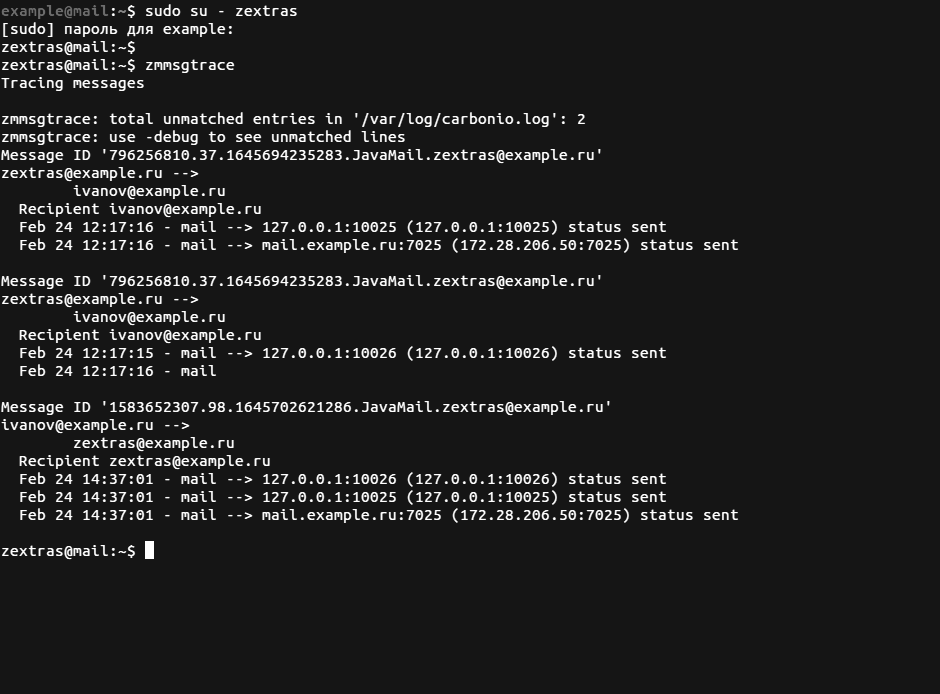
The command zmmsgtrace -s user@example.tld returns all messages sent by the user user@example.tld and the command zmmsgtrace -r user@example.tld displays all e-mails with user@example.tld as the recipient.
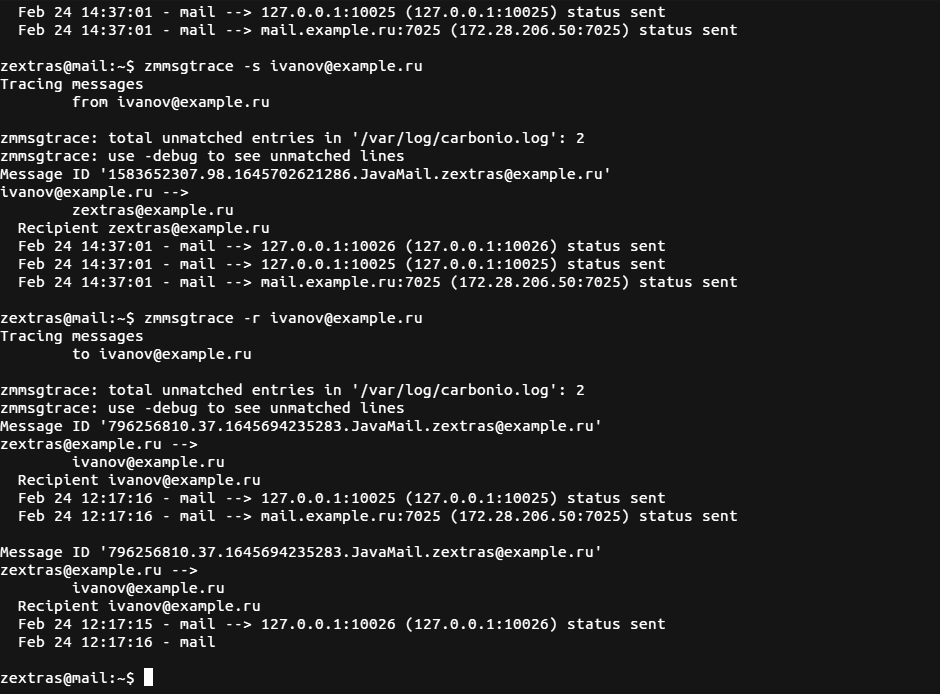
Also, this utility supports specific timespan and regular expressions:
zmmsgtrace -time 20220214,20220218– will display data on all e-mails for the working week from February 14 to February 18, 2022.zmmsgtrace -s '^z' -r '@example\.tld$'– displays all messages sent by accounts whose name starts withzand the recipient’s account name contains the@example.tlddomain.
In addition, zmmsgtrace supports searching for a message by identifier using the parameter -i, as well as by the ip-address or name of the sender’s or recipient’s mail server using the -F and -D parameters.
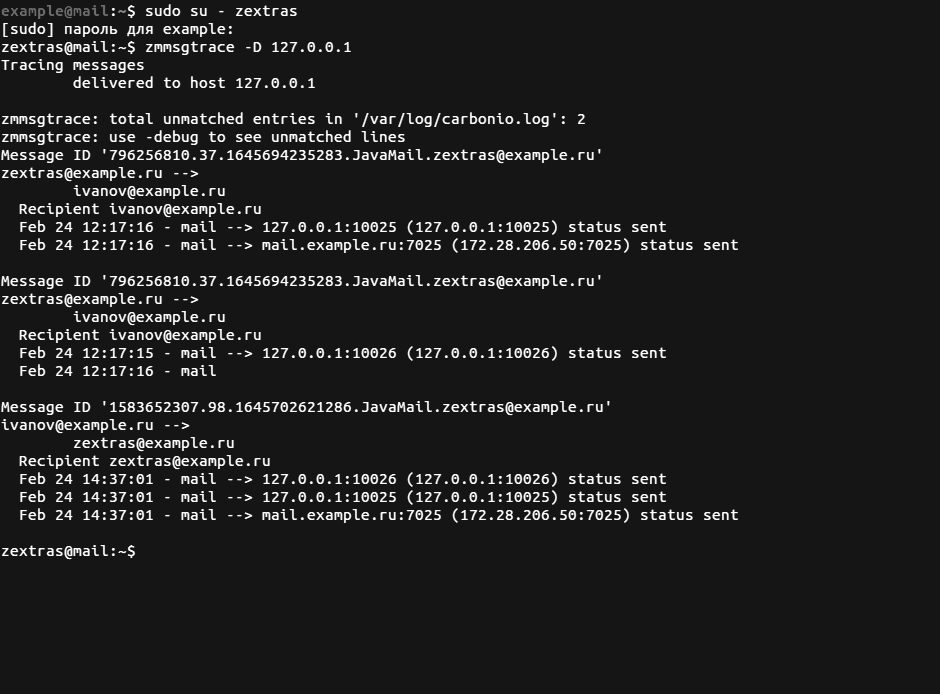
If the output of this command is gigantic, you can use the function of saving information to a text file, for example, the command will zmmsgtrace -time 20220214,20220218 > /tmp/zimbralogs.txt to save data of all messages for the working week from February 14 to February 18, 2022, into the /tmp/zimbralogs.txt file.
