For additional guidance, check out our community articles detailing the process of migrating from your current platform to Carbonio CE.
For enterprise-level requirements and advanced features, consider checking out Zextras Carbonio – the all-in-one private digital workplace designed for digital sovereignty trusted by the public sector, telcos, and regulated industries.
Collect and correctly display metrics is the best (sometimes the only) way to understand how single software components or the entire infrastructure is working and performing.
You can use the insights from Prometheus to understand systems load better, to improve/optimize infrastructure efficiency and usage, and check impact for changes in hardware configuration, and compare performances after software updates.
This article explains how to collect metrics from the Zextras Docs server and show them in Grafana.
Software Involved
I think there is no need to talk in-depth about Prometheus and Grafana here, just some quick info.
Prometheus is an open-source monitoring tool to record real-time metrics in a time-series database. The main Prometheus peculiarities are that metrics are collected using HTTP pulls, and they contain labels that are very useful to query and filter. For more information about Prometheus, see https://prometheus.io/docs/.
Grafana is a data visualization, monitoring, and analysis tool. It manages awesome dashboards representing specific metrics over a set period. For more information about Grafana, see https://grafana.com/docs/.
LibreOffice Online (LOOL) is a server daemon based on the LibreOffice source code. It provides the ability to create, edit, and display various file types using a web browser. Collabora Office is a commercial product based on LOOL that offers support and services. Collabora also publishes an open-source version called CODE that is used to test the newest features.
LOOL does not include a file system; documents are retrieved from external storage using the Web Application Open Platform Interface (WOPI) protocol.
A server running LOOL spawns three principal processes: LoolWSD, LoolForKit, and LoolKit.
LoolWSD (Libre Office On Line Web Services Daemon) listens on a public port for client connections, and when a new request arrives, it calls ForKit that forks a new Kit instance to host documents.
Zextras Docs includes three components:
- Zextras Docs Server: It is based on the same LOOL source code, contains customization to connect it to a Zimbra infrastructure.
- Zextras Docs Extension: It runs on every Zimbra mailbox server. It orchestrates communication between components and implements the WOPI protocol to allow the server components to retrieve documents from Zextras Drive.
- Zextras Docs Zimlet: It is the web interface that integrates services with Zimbra’s webmail.
For more information about Zextras Docs, see our Documentation.
Collecting Metrics
Configuring Zextras Docs
LibreOffice Online and its derivatives have an admin console (http://loolserver:9980/loleaflet/dist/admin/admin.html) where it is possible to monitor the user’s sessions running on Loolwsd instance in real-time.
Using the console, the admin can retrieve information about currently opened documents such as:
- PID of the process hosting the document
- Number of client views opening this document
- Memory consumed by the process (in kilobytes)
- Elapsed time since the first view of the document was opened (in seconds)
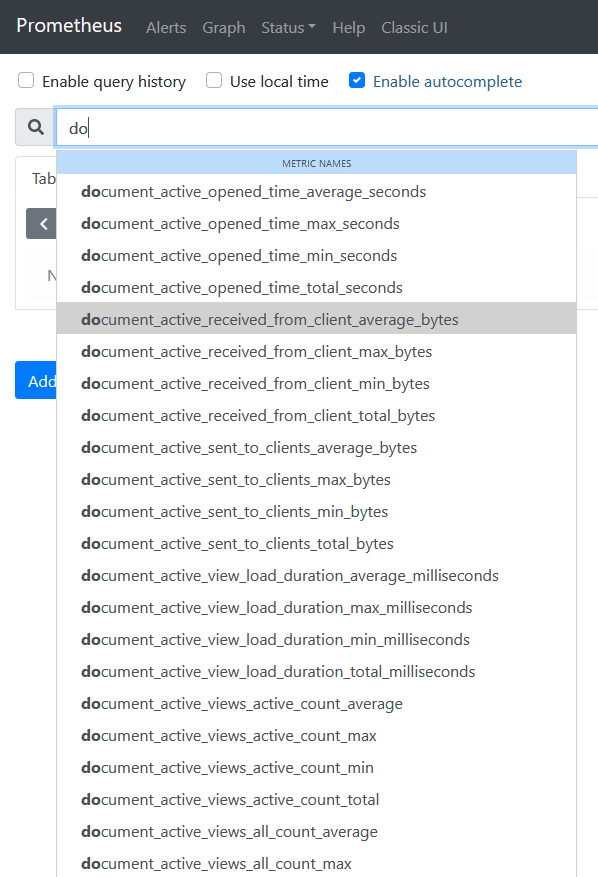
Moreover, admins can activate the console metrics compliant with Prometheus format and exposed them through the REST endpoint http://loolserver:9980/lool/getMetrics.
Those metrics provide details about Resource used, Processes, Opened and expired documents.
You can find detailed descriptions about metrics here https://github.com/CollaboraOnline/online/blob/master/wsd/metrics.txt.
Configuring Prometheus
To scrape metrics from Prometheus, you should add the following lines in the prometheus.yml config file.
- job_name: 'collabora_docs'
 static_configs:
 - targets: ['hostname:9980']
 metrics_path: "/lool/getMetrics"
 basic_auth:
 username: 'admin'
 password: 'password'
Once Prometheus reloads its configuration, it will start scraping metrics
Show metrics using Grafana dashboard by Zextras
Collected metrics are useless (or at least very hard to understand) if you can’t correctly visualize them!
Using the Grafana dashboard provided by Zextras, which can be downloaded from the Grafana repository, the admin can monitor the system or compare metrics by time interval.
You can also match data with the ones provided by other exporters to understand better what’s going on!
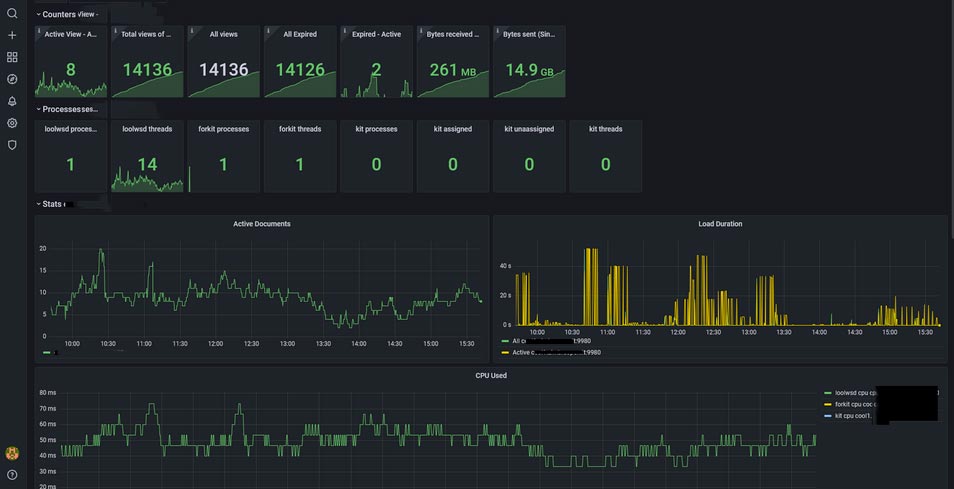
To use this dashboard, you only need to specify a Prometheus source on your Grafana.